



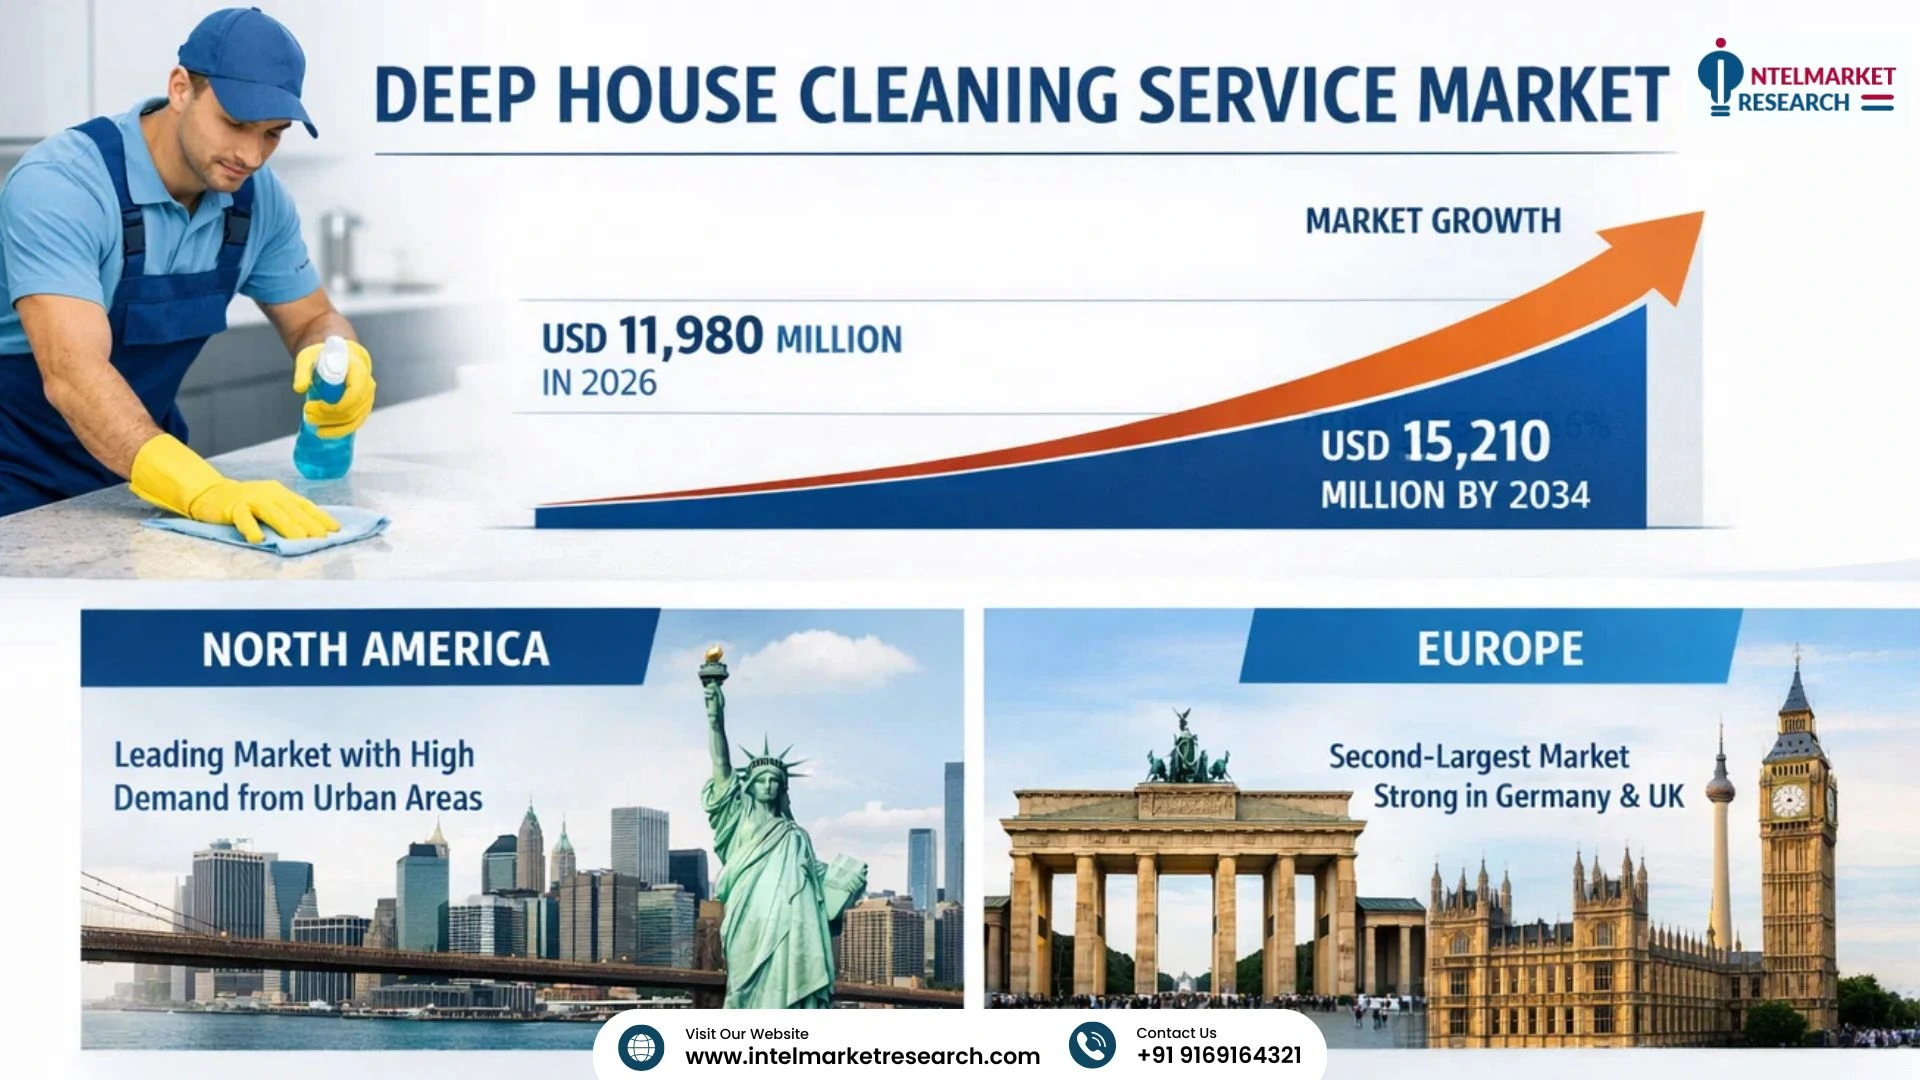
The house cleaning services industry in the United States has evolved from a discretionary luxury to a mainstream economic pillar. In 2026, this sector is defined by robust demand, significant employment figures, and a complex interplay between macroeconomic trends and local labor dynamics. This article provides a detailed, data-driven analysis of the industry’s economic footprint, market structure, growth drivers, and future outlook.
1. Market Size, Growth Trajectory, and Macroeconomic Context
The U.S. house cleaning services market operates within the broader, massive home services economy. Total U.S. spending on home services is approximately $700 billion, with the cleaning segment representing a substantial and fast-growing portion of this figure . This sector falls into the “frequent and optional” category of home services, which has experienced some of the fastest growth rates .
While the overall home services market grew at a compound annual growth rate (CAGR) of roughly 5% in the pre-pandemic years and spiked to 13% during the pandemic, the 2022–2024 period saw a slowdown. However, the outlook remains positive. The market is expected to resume growth at an annual rate of around 2%, a pace that could track or slightly exceed GDP growth through 2030, potentially reaching an $802 billion total market value . This suggests a maturing but resilient market for cleaning services.
Table 1: U.S. Home Services Market Growth Trajectory (2015–2030F)
| Period | Estimated CAGR | Market Context & Drivers |
| 2015–2019 | ~5% | Steady pre-pandemic growth driven by rising incomes and busy lifestyles. |
| 2020–2021 | ~13% | Pandemic-induced surge; heightened focus on health, sanitization, and time spent at home . |
| 2022–2024 | ~Flat (0%) | Post-pandemic normalization; market consolidation and inflation impact . |
| 2025–2030F | ~2% | Moderate, sustainable growth aligned with GDP; driven by service formalization and recurring demand . |
The growth in this sector is not solely based on the creation of new demand. Instead, it represents a significant shift in how household labor is sourced. The industry is seeing a major move away from informal arrangements—such as hiring through word-of-mouth—toward branded, platform-driven, and standardized service delivery .
2. Employment and Labor Economics
The house cleaning industry is a major employment driver. The U.S. Bureau of Labor Statistics data indicates that as of May 2023, over 836,000 people were employed as residential cleaners in the United States. This figure is separate from the more than 2.3 million janitors and building cleaners employed across commercial sectors .
Table 2: U.S. Cleaning Industry Employment and Wage Snapshot (as of May 2023)
| Category | Total Employed (U.S.) | Median Hourly Wage | Key Future Projection |
| Residential Cleaners | >836,000 | $16.08 | – |
| Janitors & Building Cleaners | >2.3 million | $16.84 | 336,700+ new jobs expected by 2032 |
| HCPA Member Companies | 308,000 (direct) | N/A | Supports >723,000 jobs when including indirect impacts |
The industry’s economic ripple effect is substantial. The Household & Commercial Products Association (HCPA) notes that its member companies alone, which manufacture cleaning products, support more than 723,000 jobs and contribute nearly $127 billion in GDP to the U.S. economy .
The Wage Spectrum and Business Model Variations
Wages in the cleaning sector vary significantly based on the business model. Commission-based structures and per-job pricing are common, often resulting in higher effective hourly rates for top performers.
Table 3: Comparative Analysis of House Cleaner Compensation Models
| Business Model & Location | Pay Structure | Effective Hourly Rate / Weekly Pay | Key Conditions & Benefits |
| Commission-Based (Findlay, OH) | 45% commission per clean | $16–$22/hr; Top performers >$1,000/week | Requires personal vehicle; flexible schedule. |
| Performance-Based (Naperville, IL) | Pay-for-performance with tips | $20–$25/hr + tips; Training pay $17/hr | Eligible for 401(k) matching, PTO, mileage reimbursement after certification. |
| Per-Job / Premium (Birmingham, AL) | Paid per job; Top 10% industry pay | $30–$40+/hr; Same-day pay | Requires cleaning experience; chosen by the “best cleaners” to ensure quality. |
| Flat Weekly (Naples, FL) | Guaranteed weekly salary | $400–$700/week (works out to approx. $10–$17.50/hr) | No weekends, company provides vehicle and gas, PTO offered. |
This variation in pay scales underscores the industry’s bifurcation: companies that treat cleaners as low-cost labor may face high turnover, while businesses that offer premium pay and benefits (like those seen in the Birmingham market) often secure higher-skilled, more reliable staff and command higher prices from clients .
3. Key Economic Drivers of Demand
According to Inthetalks several interconnected factors are fueling the sustained demand for house cleaning services across the United States:
- Aging Population and Health Concerns: An older demographic increasingly requires assistance with home maintenance. The post-pandemic era has also instilled a lasting focus on health and sanitization, making professional cleaning a priority for many households .
- Busy Professionals and Dual-Income Households: As the cost of living rises, households often rely on multiple incomes. This leaves less time for domestic chores, prompting many to outsource cleaning. Approximately 1 in 6 U.S. households now hire cleaning services .
- High Homeownership Rates and Real Estate Turnover: The number of existing homes is high, and real estate turnover—including move-out and move-in cleaning—creates consistent demand . Rental properties and short-term vacation rentals (like Airbnb) also contribute to recurring service needs.
- Growth of Service Platforms: Online platforms and apps have reduced the friction of finding and booking cleaners, increasing market accessibility and transparency . This “platformization” has lowered the barrier to entry for both consumers and service providers.
4. Industry Structure: Fragmentation and Formalization
Despite its size, the residential cleaning market in the U.S. remains highly fragmented. Franchise businesses (such as Molly Maid, Merry Maids, and The Cleaning Authority) account for only about 10% of total revenue in the cleaning industry . The vast majority of the market consists of independent local companies, individual operators, and platform-based gig workers .
This fragmentation is a key economic characteristic. It creates opportunities for new entrants but also introduces challenges regarding service consistency, labor regulation, and pricing power. The current trend of “formalization” is where the economic value is increasingly captured: the shift from informal, cash-based work to fully insured, tax-compliant, and standardized service businesses is creating a more stable, predictable, and investable market .
5. Future Outlook and Emerging Trends
Looking toward the 2026–2032 period, several trends are set to shape the economics of the house cleaning industry:
- Robust Global Market: The global residential cleaning market is expected to grow from an estimated $748.6 billion in 2025 to $1.078 trillion by 2032 .
- The Rise of “Clean Tech”: While robotic vacuums and smart home devices handle surface-level cleaning, they are not replacing human cleaners. Instead, these tools are shifting the focus of human cleaners to high-value, complex tasks like deep cleaning, sanitization of high-touch surfaces, and organizing .
- Labor and Regulatory Pressures: The single biggest challenge to future growth is labor. Finding and retaining reliable workers is a primary economic constraint. Furthermore, regulatory changes, particularly concerning platform workers’ rights and benefits, could significantly raise costs for the major digital booking platforms .
- Sustainability: Demand for “green cleaning” is growing, influencing the products used and the services offered. This can command a premium price point, altering the financial dynamics of the industry .
Conclusion
The economic impact of house cleaning services in the USA is profound and expanding. It supports over 800,000 direct jobs, generates billions in revenue, and has been a more resilient sector than many others during economic fluctuations. The industry is transitioning from a fragmented, informal service into a structured, tech-enabled market. Its future growth hinges on successfully navigating the challenges of labor supply, managing operational costs, and c


