


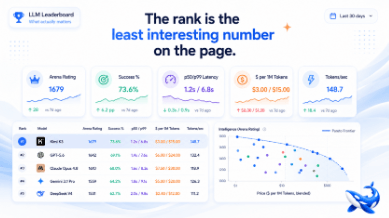
Most people read an LLM leaderboard the way they read a sports table: they look at who’s #1 and stop. But the columns you *don’t* look at — reliability, tail latency, cost per token — are often the ones that decide whether a model works for you in production. A serious board like OrcaRouter surfaces all of them, because the headline rank is the least useful number on the page.
This article is a field guide to every metric on a live LLM leaderboard: what each one means, and how much weight it deserves.
Quality: Arena Rating and win rate
The headline metric is usually a quality score from head-to-head battles — an Arena Rating or win rate, aggregated from blind votes with a Bradley–Terry (Elo-style) model.
- A higher rating means the model wins more matchups against a random opponent.
- Always check the confidence interval. If two models’ bands overlap, they’re statistically tied.
- Check the vote count. A rating built on 3,000 votes is trustworthy; one built on 30 is noise.
Quality is where most people stop. It should be where you *start*.
Reliability: success rate
Success rate — the percentage of live requests completed without erroring or timing out — never makes the marketing slides but matters enormously. A model can top the quality chart and still fail 3% of requests under load. For anything customer-facing, treat a high success rate as a hard requirement.
Speed: p50 and p99 latency
- p50 (median) — the response time a typical request sees.
- p99 — the 99th-percentile, *worst-case* response time.
p50 tells you how fast the model usually feels; p99 tells you how bad it gets on a bad day. A model with a great median but terrible p99 will feel snappy, then occasionally hang long enough to lose a user. For interactive products, p99 is often the more important number.
Cost: price per million tokens
Cost per 1M tokens — usually split into input and output — turns an abstract quality ranking into a business decision. Output tokens are typically priced higher, so a chatty model that generates long responses can cost far more than its headline price suggests. At scale, cost can dominate every other consideration.
Throughput: tokens per second
Throughput measures how fast a model streams tokens back once it starts. A high-throughput model *feels* fast because text appears quickly. For streaming chat, throughput and latency together shape the whole experience.
The metric that ties it together: intelligence vs price
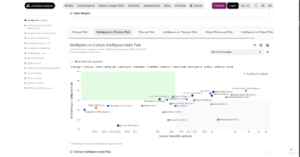
The single most valuable *view* isn’t a column — it’s the plot of quality against cost. Models on the Pareto frontier offer the best quality at each price point; everything below is beaten by something both cheaper and smarter. It’s where teams routinely discover an open-weight model beside a flagship at a fraction of the cost.

Trust signals: validation and trends
- External validation. Rigorous boards report how closely their ranking correlates with independent references, using Spearman’s ρ and Kendall’s τ.
- Trends over time. Boards that track ratings over a rolling window can flag a model whose quality has quietly regressed.
You can see all of these signals together on the OrcaRouter LLM leaderboard, which combines blind-battle quality with real production-traffic reliability, latency, and cost — and validates the whole ranking against external references rather than relying on vendor-reported benchmarks.
How to weight the metrics for your use case
| Use case | Weight most heavily |
| User-facing chatbot | p99 latency, success rate, quality |
| High-volume batch job | Cost per token, throughput |
| Coding assistant | Category quality, p50 latency, cost |
| Research / evaluation | Quality rating, external validation |
The takeaway
The rank at the top of an LLM leaderboard is the least interesting thing on the page. The real value is in the metrics beside it: success rate for reliability, p50 and p99 for speed, cost per token for economics, and the intelligence-vs-price frontier for the trade-off that drives your decision. Next time you’re evaluating a model, go past #1 and study the full set of metrics on an LLM leaderboard — that’s where the right choice is hiding.