


A new national analysis conducted by The Texas Law Dog reveals striking differences in hit and run fatality rates from state to state. The study, based on federal crash data from 2019 through 2023, shows how geography, population density, and driver behavior influence the risk of deadly crashes. It highlights the states where drivers are most likely to flee the scene after causing a fatal collision and draws clear contrasts between large metro states and rural regions with far fewer incidents.
Five-Year Crash Totals and National Patterns
Between 2019 and 2023, the United States recorded nearly 4 million hit and run crashes, resulting in approximately 13,000 deaths. The year 2022 saw the highest number of hit and run crashes, with 2,895 incidents reported. September and October tied as the most dangerous months, each recording 280 crashes. Of the 13,000 fatalities, 1,271 were drivers who caused the crash and then fled. These figures show that hit and run incidents are not isolated events but a persistent nationwide issue affecting every region.
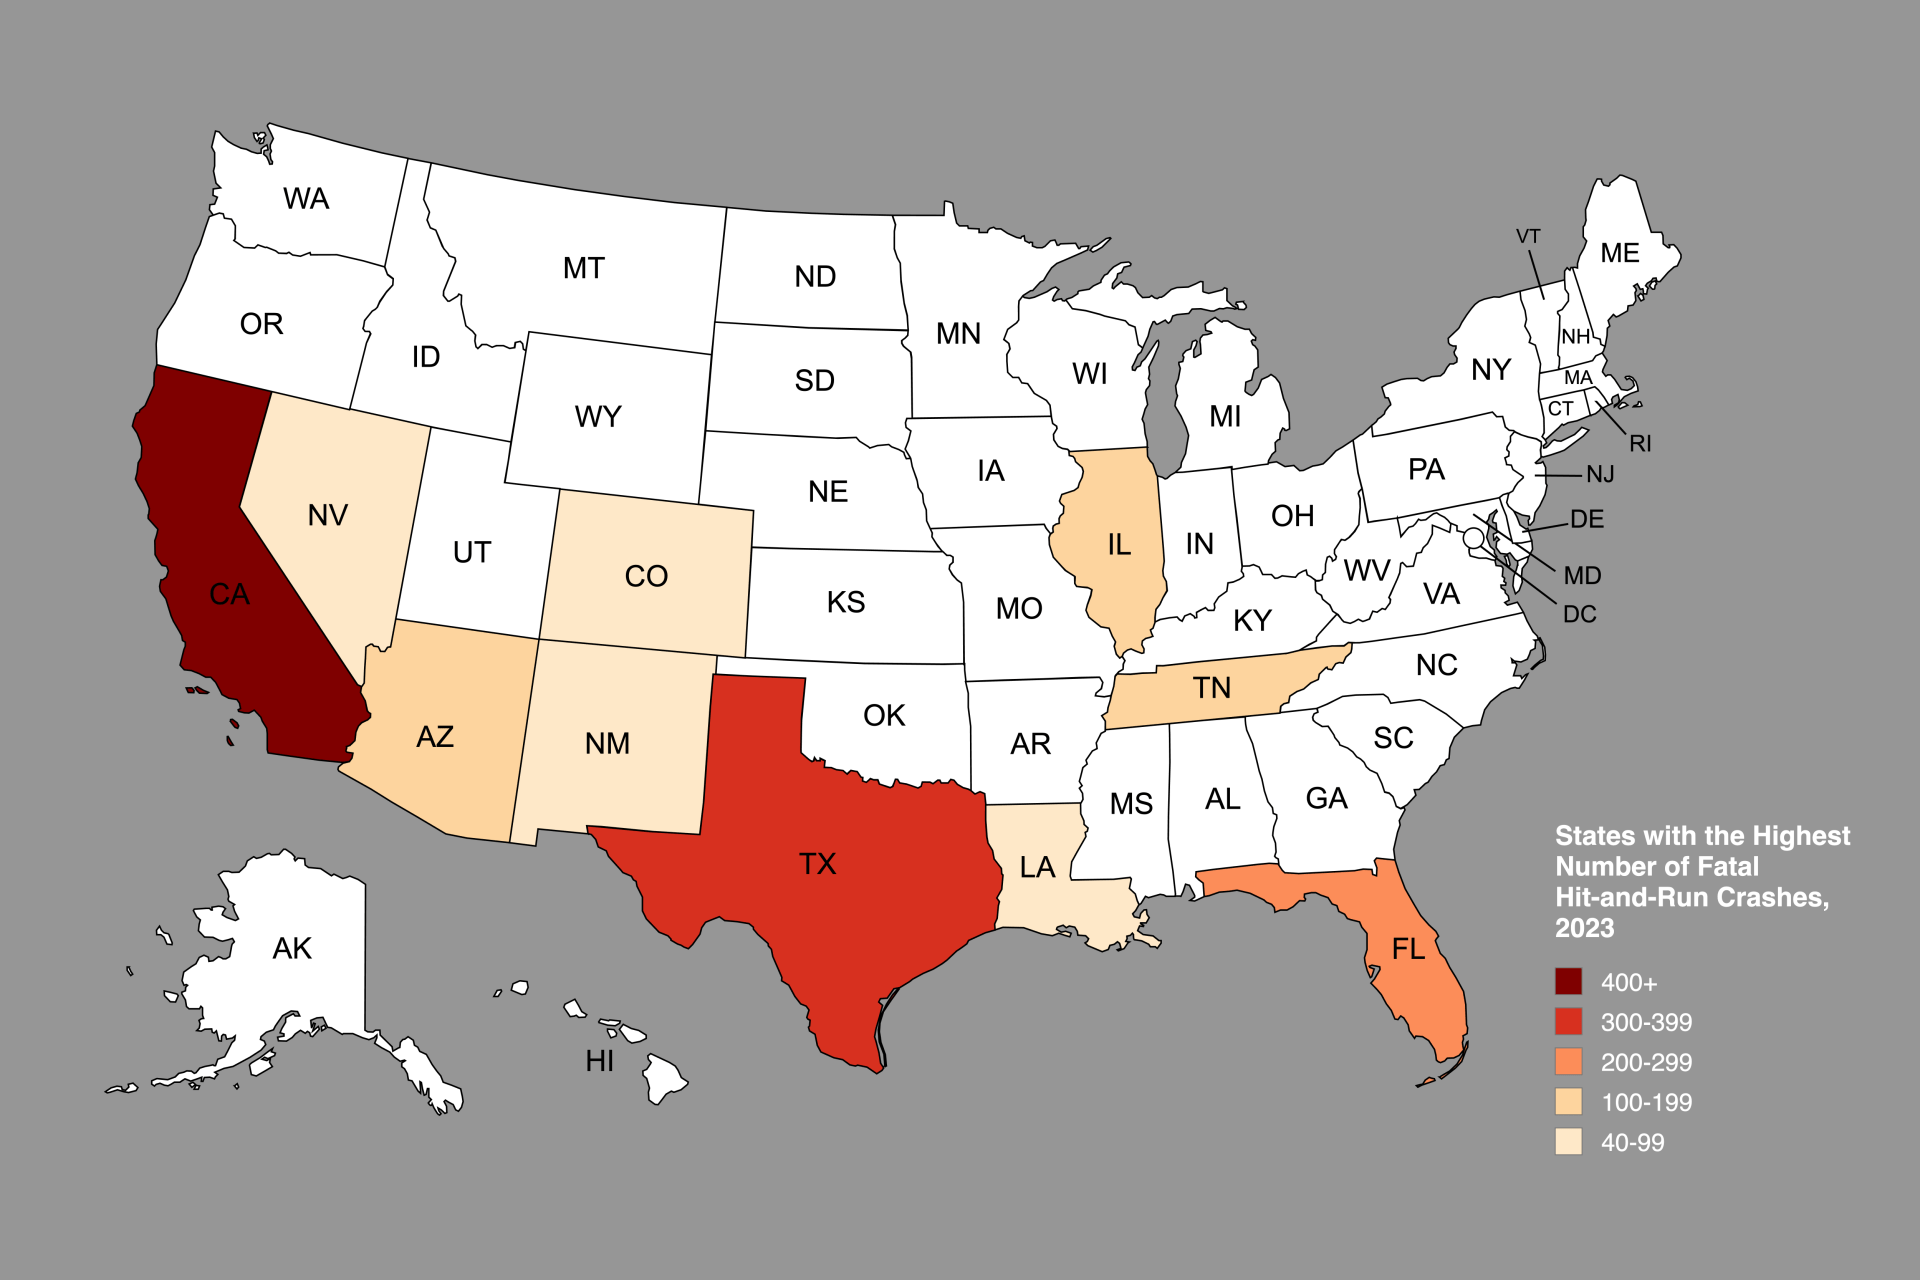
States with the Highest Fatality Totals
Several large and densely populated states recorded the highest number of hit and run deaths. California led the nation with 2,178 fatalities. Florida reported 1,260 deaths, while Texas followed with 973. Other states posting high totals included Illinois, Georgia, New York, Tennessee, and Arizona. These states share common characteristics such as large populations, heavy traffic congestion, and dense urban centers where speeding, distracted driving, and impaired driving are more frequent.
States with the Lowest Fatality Totals
In contrast, rural Northeastern and Mountain West states recorded significantly fewer fatalities. Maine reported just four hit and run deaths during the five-year period. New Hampshire recorded six, while Vermont and Wyoming each recorded eight. North Dakota, Idaho, and South Dakota also posted low totals. Smaller populations, reduced traffic density, and fewer high-speed urban corridors help explain the lower incidence rates in these regions.
Pedestrian Fatalities and Urban Exposure
Pedestrian deaths followed a similar pattern. Nationally, 8,442 pedestrians were killed in hit and run crashes between 2019 and 2023. California recorded 1,485 pedestrian fatalities, followed by Texas with 973 and Florida with 749. Georgia, New York, and Arizona also ranked among the highest. In comparison, Maine recorded just three pedestrian hit and run deaths, and New Hampshire recorded four. States with fewer urban centers and less nighttime foot traffic consistently showed the lowest numbers.
Speeding as a Leading Factor
Speeding was the most common contributing factor in fatal hit and run crashes, accounting for 2,506 deaths nationwide. California recorded 597 speeding-related fatalities, while Texas reported 355. Illinois, New York, and Arizona posted lower totals by comparison. Vermont recorded only one speeding-related fatality, the lowest in the country. Other rural states, including Idaho, West Virginia, and Alaska, also reported minimal numbers tied to speeding.
Distracted Driving Contributions
Distracted driving contributed to 1,019 fatal hit and run crashes across the country. Texas recorded the highest number with 165 fatalities, followed by Illinois with 129. New Mexico, New York, and Florida also reported elevated totals. Rural states such as Delaware, Idaho, and Maine recorded just one distracted driving-related fatality during the five-year period, reinforcing the urban-rural divide.
Impaired Driving Involvement
Impaired driving played a significant role in fatal hit and run incidents. Nationwide, 733 fatalities involved an intoxicated driver. California recorded 184 impaired driving-related deaths, followed by Texas with 101. Florida, North Carolina, and New York rounded out the top five. States with the lowest totals included Idaho, Kansas, Maine, and Minnesota, each reporting only one fatality.
Uninsured and Unlicensed Driver Impact
The study also examined uninsured and unlicensed drivers. Uninsured drivers were responsible for 181 fatal hit and run crashes, with Illinois leading at 39, followed by Tennessee with 31 and Texas with 12. Unlicensed drivers were involved in 1,481 fatal hit and run crashes nationwide. Texas recorded the highest number at 319, surpassing California’s 235 and Florida’s 104, highlighting the risk posed by drivers operating without proper credentials.
Demographic Trends in Fatalities
Demographic data shows that men are disproportionately affected by fatal hit and run crashes. Of the 10,853 fatalities with recorded age and gender information, men accounted for 8,379 deaths. The age group most affected nationwide was 25 to 34, with 3,033 fatalities. In Texas, men in this same age group represented the largest share of victims, totaling 399 deaths.
Conclusion and Ongoing Safety Concerns
The Texas Law Dog study underscores that hit and run incidents are influenced by driver behavior, roadway conditions, and population density. States with large metropolitan areas and heavy traffic consistently record the highest fatality totals, while rural states with smaller populations report far fewer incidents. The data reinforces the urgent need to address speeding, impaired driving, distracted driving, and licensing enforcement to reduce the number of fatal hit and run crashes across the United States.


